A Picture is Worth a Thousand Words: Word Clouds for Data Representation
Build a Word cloud easily
Overview
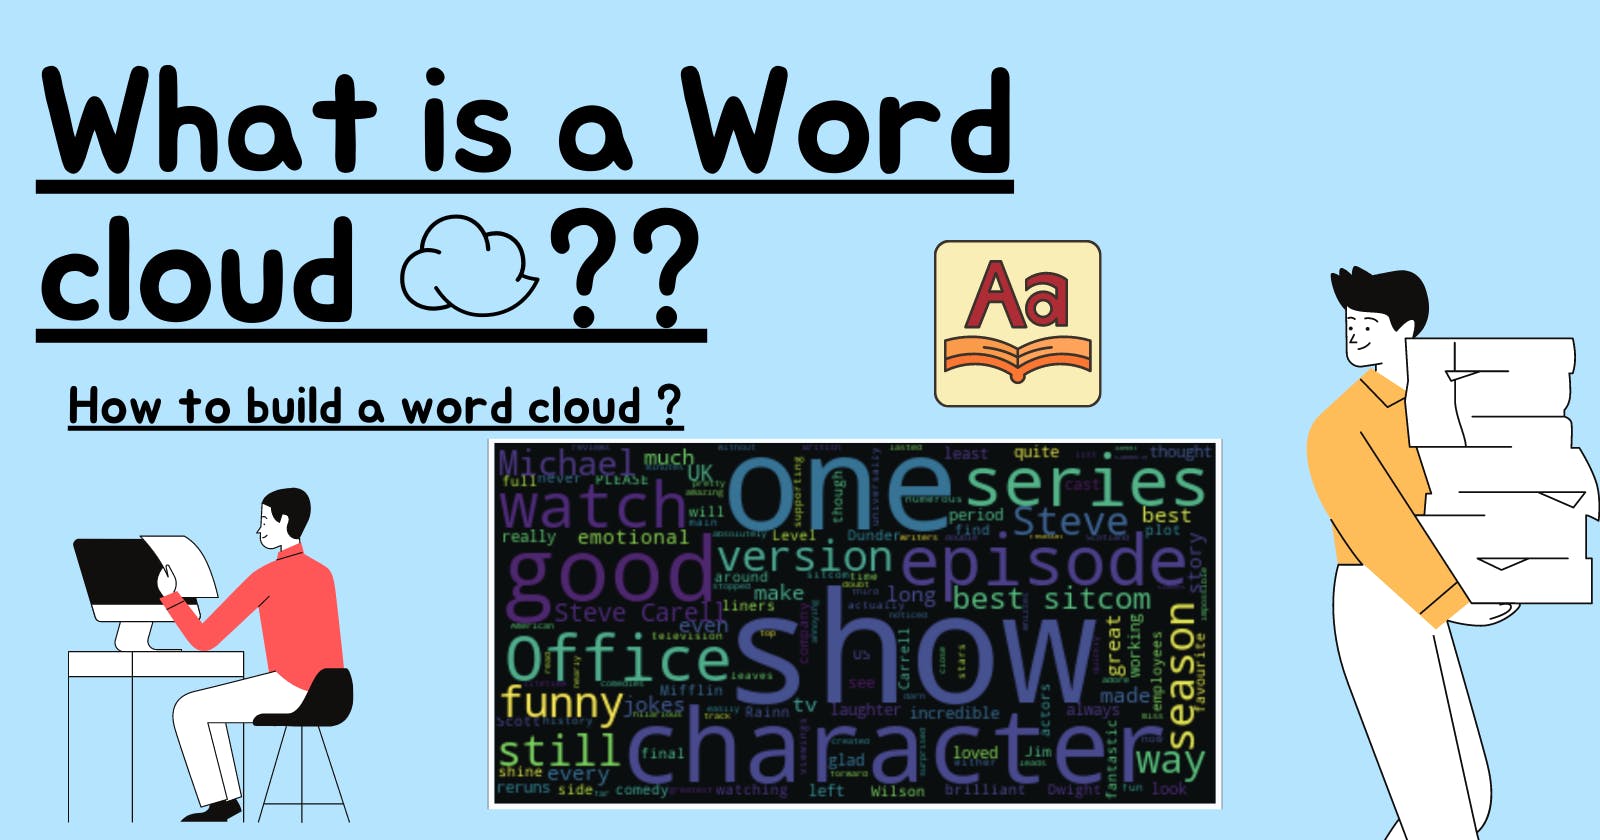
No, it has nothing to do with Cloud computing. A word cloud, as the name depicts, is a cloud or collection of words where each word is given in a different size. It is a visual representation of textual data. When a word is more often mentioned in a text, that is, if the frequency of a particular word is high it appears bigger and bolder. The height of each word is an indicator of the frequency of occurrence of the word.
So how does a Word cloud exactly help us??
Instead of reading the whole text to understand the context, a word cloud provides rapid analysis, showing the important words. The smaller the words appear, the lesser the frequency. It helps to do an exploratory analysis of the text by identifying the words that frequently occur in a large document. It is used for summarizing important points from big reports.
Application of Word cloud
Word cloud is used in Search Engine Optimization(SEO). A word cloud helps in identifying keywords that can be existing on a website to help it appear at the top in search results.
Competitive analysis of competitor websites and getting unique selling propositions of competitors.
Market and product research by getting the pulse of customers through social media and other discussion forums.
Analyzing the market approach of a company by understanding the customer reviews and pain points from text clouds.
To build a word cloud, the text should be converted to a suitable form, which can be understood by the software before forming a word cloud.
Simple python example
Now I will show you a simple example of Word cloud. For this word cloud, I have collected 5 users' IMDb reviews of The Office US. Because I am a huge fan of that series.
pip install wordcloud
#Import all necessary modules
from wordcloud import WordCloud, STOPWORDS, ImageColorGenerator
import matplotlib.pyplot as plt
import pandas as pd
# Here is my dataset
text_data = pd.read_csv("/content/office_reviews.csv")
# It has 2 columns
text_data.head()

#some preprocessing any plotting the Word cloud
text = ' '.join(i for i in text_data.Review)
stopwords = set(STOPWORDS)
wordcloud = WordCloud(stopwords = stopwords, background_color ='black').generate(text)
plt.figure(figsize=(15,10))
plt.imshow(wordcloud, interpolation='bilinear')
plt.axis('off')
plt.show()
And the result looks like *Drumroll sound here*

As you can see, the most frequent words are having a large font and the least frequent is having smaller font. This reflects that words like 'show', 'character', 'one', and ' good' are most frequently used.
Thank you for reading.
Have a nice day😁!
For more such content make sure to subscribe to my Newsletter 👉 here
Follow me on ⬇︎

